Traffic acquisition
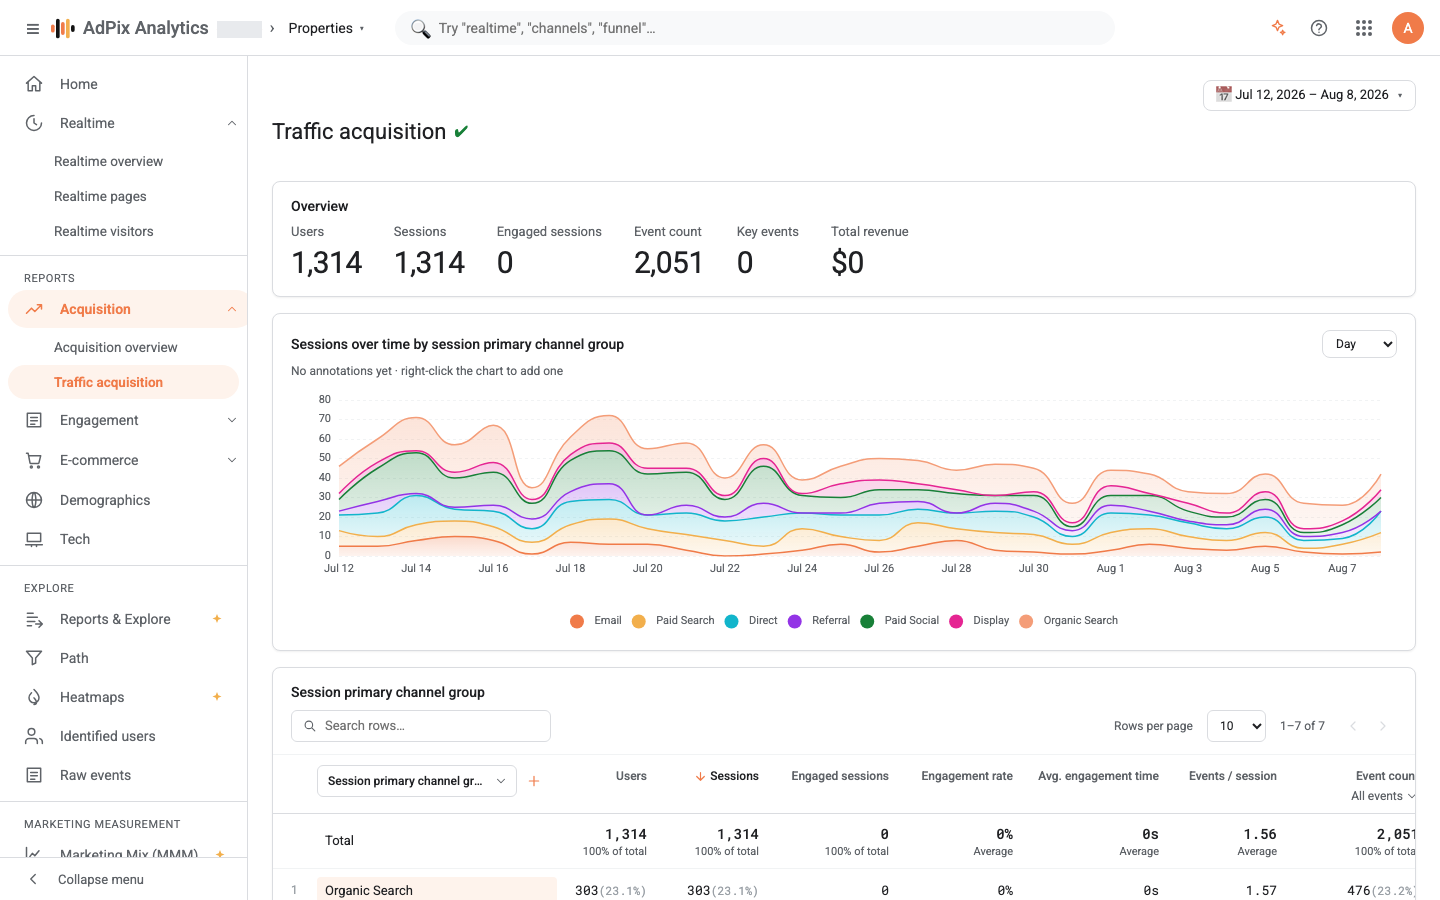
The detailed session-scoped report: every session is attributed to the touch that brought that session in, not to the campaign that found the person six months ago. Switchable dimensions, engagement and revenue columns, and a table you can sort, search and slice.
What sets this report apart#
Traffic acquisition lives at /traffic and its unit of counting is the session. Each session is attributed to the touch that brought that session in — the source, medium and campaign of the session's own first event.
That sounds obvious, but it is precisely the point that used to be wrong, and fixing it moved the numbers visibly. Before, the report grouped sessions by the user's lifetime first touch. A returning customer who clicked a Facebook ad today was reported under the Google ad that had found them six months earlier. Every returning visitor — the best part of your audience — was misattributed, systematically, and newer campaigns always looked weaker than they were.
The division of labour is now clean:
| Question | Report | Scope |
|---|---|---|
| What first brought these users in? | Acquisition overview | the user's first touch |
| What drove traffic this month? | Traffic acquisition | the session's own touch |
GA4 draws the same line: User acquisition is first-touch, Traffic acquisition is session-scoped. If this page and the Acquisition overview disagree, nothing is broken — you have put two different scopes side by side.
Primary and secondary dimensions#
The primary dimension is the table's first column and is changed from the control above the table. There are six options, all session-scoped:
- Session primary channel group
- Session source / medium
- Session source
- Session medium
- Session campaign
- Session source platform — the type of click ID the session arrived with, or
Manualwhen there is none
+ Secondary dimension adds a second grouping column, organised into four groups: Traffic source (source, medium, source / medium, campaign), Page / screen (hostname, page path, landing page), Geography (country, region, city), and Platform / device (device category, browser, operating system).
The secondary dimension is read from the session's first event too. So "landing page" really is the page that session entered on, and "country" is where the session started.
Your dimension, secondary dimension, time grain, sort column and rows-per-page are remembered and restored the next time you open the report.
The columns#
| Column | Definition |
|---|---|
| Users | unique users with at least one session in this row |
| Sessions | the row's session count |
| Engaged sessions | sessions meeting the engagement condition (below) |
| Engagement rate | engaged sessions as a percentage of the row's sessions |
| Avg. engagement time | total engagement time divided by session count |
| Events / session | total events divided by session count |
| Event count | events in the row — the column picker can narrow it to a single event |
| Key events | events marked as key events on the property |
| Session key event rate | share of sessions with at least one key event |
| Total revenue | the summed value parameter on key events |
The table is ordered by sessions and returns up to 500 rows.
Engaged sessions#
A session is engaged when at least one of these holds:
- engagement time of at least 10 seconds;
- at least two page views;
- at least one key event.
Bounce rate is nothing but the inverse: bounce rate is 100 minus the engagement rate. If engagement rate is 62%, then 38% of sessions bounced. That is why there is no separate bounce column here — it is the same number, viewed from the other side.
A good landing page can have both a high bounce rate and a high engagement rate, because the visitor stays on that one page, scrolls, and submits the form. Mark the form-submit event as a key event and those sessions count as engaged, which is the truer picture.
Where engagement time comes from#
Avg. engagement time is built from the user_engagement event. The tracker emits it when the page is hidden and on every route change in a single-page app, carrying the real time spent on that page in the engagement_time_msec parameter. Any span longer than thirty minutes is discarded, so a forgotten background tab cannot report a fake multi-hour dwell.
What is not used for it is the server's event receipt time. Events are sent in batches, so the spread between a session's first and last receipt time says nothing about how long the person was actually there.
The chart and the time grain#
The chart above the table plots sessions over time, split by the same primary dimension, with Day / Week / Month on the card's control. Day and month buckets are cut in the property's timezone; the week bucket starts on Monday.
Chart and table are built at one grain: both count one row per session. Search the table's rows and the chart narrows to the same surviving values.
With period comparison on, the headline metrics show the change and the previous period is drawn on the chart.
Working the table#
- Sort on any column by selecting its header.
- Row search filters the rows, and while it is active the Total row reports the filtered set's share of the whole.
- Share of total appears under each summed column; for rate and time columns you get the distance from the average instead.
- The per-column event picker narrows two things: Event count to any single event, and the key-event columns (with their revenue) to one specific key event. This is the same move as picking an event in a GA4 column header.
- Below the table, the events counted as key events are listed alongside the engaged-session definition.
Getting attribution right when checkout goes through a payment gateway#
This deserves its own section because it lands directly on this table. When a customer pays, the gateway redirects them back to your site, and the browser reports that return as a referral from the gateway's domain. Left alone, the session that converts files under the bank's referral and the sale is credited to the payment processor; the ad channel looks unprofitable and budget moves on a wrong number.
AdPix demotes known payment gateways at collection time — exactly the way it treats a referral from your own domain — and then restores that visitor's durable last touch, so the converting session is not left with no campaign at all. The base list covers the Shaparak switch, the local gateways and the global processors, and each property can add its own hosts.
Look at the top rows of the table. If a payment-gateway domain, one of your own subdomains, or a payment partner is sitting there, that traffic is not acquisition and the host belongs on the excluded list.
Small print you will end up needing#
- Server-side events carry no session and do not appear in session counts; they are fully present in event counts, key events and revenue.
- Users here is counted from the visitor ID, so one person on two browsers is two users. To join them into one person, see how AdPix identifies visitors.
- Test-mode events are not counted in any row.
- Total revenue sums the
valueparameter without separating currencies; for a per-currency split, use the e-commerce report.
Frequently asked questions#
What exactly is an engaged session?
A session that meets at least one of three conditions — engagement time of 10 seconds or more, two or more page views, or at least one key event. Engagement rate is the share of sessions that qualify; bounce rate is the exact inverse of it, 100 minus the engagement rate.
Why don't these numbers match the Acquisition overview?
Because this report is session-scoped and that one is user-scoped. Here each session sits under the touch that brought it in; there each user stays under their permanent first touch. For returning customers the two deliberately differ.
Where does average engagement time come from?
From the user_engagement event the tracker sends, which carries the real time spent on the page. Server receipt time is not used for it, because events are sent in batches and the spread of receipt times says nothing about real dwell.
Why aren't the orders I send from my server counted in sessions?
Because a server-side event has no browser session and AdPix deliberately does not fabricate one. Those events are fully present in event counts, key events and revenue; they are absent only from metrics whose unit is the session.
Thanks — your feedback helps us improve the docs.