The Home page
Home is seven cards that together summarise a whole property. This page says exactly where each number comes from — including average session duration, which is not built from the gap between event timestamps.
The seven cards#
Home is not a report; it is a first look. Seven cards, each answering one frequent question and then handing you off to the full report on that subject.
| Card | What it shows | Link at the foot |
|---|---|---|
| Users · current range | The four headline numbers and the daily users trend | View reports snapshot → /acquisition |
| Device category | The desktop / mobile / tablet split of your users | View tech → /tech |
| Top channels | The first seven channels with users, sessions and conversion | Acquisition → /acquisition |
| Conversion funnel | A preview of one fixed five-step funnel | Funnel → /funnel |
| When do your users visit? | A day-of-week × hour heatmap | — |
| Users right now | Active users in the last 30 minutes, plus identified users | Realtime report → /realtime |
| Where are your users? | A world map of users by country | View demographics → /geo |
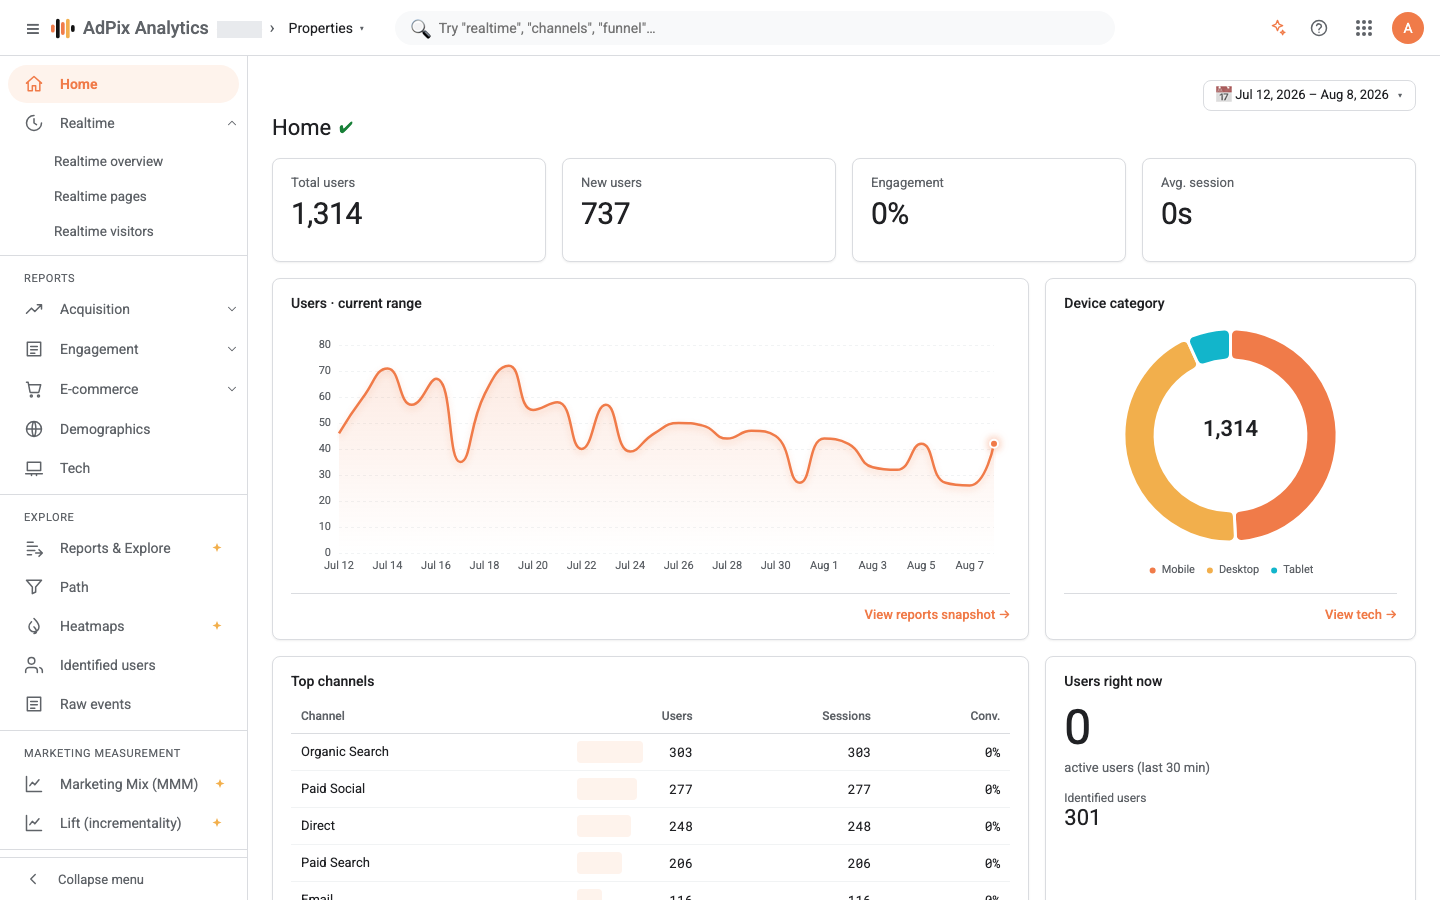
Every card except "Users right now" reads from the range you picked in the date selector at the top of the page. That one card always shows the live 30-minute window and ignores the range entirely.
The four headline numbers#
| Number | Exact definition |
|---|---|
| Total users | Unique visitors in the range, keyed on the anonymous device ID |
| New users | Visitors whose first_visit event falls inside this range |
| Engagement | The share of sessions with more than one page view |
| Avg. session | The average of real engagement time per session |
Engagement is the complement of bounce rate: a session with a single page view counts as a bounce, everything else as engaged. So if your bounce rate is 38%, this card reads 62%.
New users comes from an event definition, not from counting identity records. The tracker stamps each device's very first visit with a first_visit event, and Home counts that event inside the range. Because it is counted over the same rows and the same population that produce total users, it cannot exceed them.
Where average session duration comes from#
This is the most important detail on the page. In AdPix an event's time is its server receipt time, not the moment it happened in the browser. The tracker sends events in batches, so several events from one session can land in the same millisecond. Compute session length as the gap between the first and last row and it collapses to zero for a large share of sessions — which is exactly what used to happen.
So duration is read from the tracker's own signal instead: the engagement_time_msec parameter, carried on the user_engagement event, which holds the time the user was genuinely active on the page. AdPix sums that value per session, then averages those sums across the sessions in the range.
A tab the user left open but stopped using does not inflate session duration. In exchange, any error in page-view counting lands directly on this number too, because user_engagement travels alongside the page view.
Top channels#
This card ranks the first seven channels by users and gives three numbers for each: users, sessions and conversion.
The Conv. column is that channel's key-event count divided by that channel's session count. Two consequences worth knowing:
- If no key events are defined for the property, this column stays zero for every channel.
- Because the numerator counts events and the denominator counts sessions, one session with several key events can push the figure above 100%. It is a ratio, not a rate.
Every event's channel is computed from your current channel rules when the report is read, not when the data was collected. Change a channel definition and this card immediately reclassifies all of history under the new definition — no reprocessing job is involved.
A channel with no recognised source appears as "(none)".
Conversion funnel#
The Home funnel is fixed and always follows the same five steps: page_view, session_start, add_to_cart, begin_checkout, purchase. Steps with no users in the range are dropped, and if fewer than two remain you get this line instead of a chart:
"Not enough funnel events yet — wire add_to_cart / begin_checkout / purchase, or build one in Funnel."
So on a site with no e-commerce events the card is deliberately empty. For any other funnel use the Funnel report itself, where you choose the steps.
Visit times and the country map#
The "When do your users visit?" heatmap buckets event counts into a day-of-week × hour grid. Those day and hour buckets are evaluated in the property's timezone — not your browser's and not UTC. Change the property timezone and this grid shifts with it.
The map at the foot of the page plots users by country and covers up to 250 countries. For a city and region breakdown, go to the demographics report.
Users right now#
This is the one card that ignores the selected range. The large number is the count of unique visitors who sent at least one event in the last 30 minutes — the same definition and the same window the Realtime overview uses, so the two can never disagree.
The smaller number beneath it, "Identified users", belongs to the selected range rather than the last 30 minutes: unique users in the range who resolved to a real identity in your business.
Comparing with the previous period#
The green and red deltas beside the four headline numbers, and the dashed line on the trend, appear only when you switch comparison on in the date selector. Home used to show that comparison unasked, and readers could not tell what the number was being measured against; now nothing is compared until you ask for it.
When a card is empty#
If the cards have data but the numbers are not believable, check page-view counting before anything else — it is the base number that engagement, session duration and the funnel all ride on. Page views and single-page apps covers the counting rule and the most common installation mistakes.
Frequently asked questions#
Why can new users never exceed total users?
Because both are counted over the same rows and the same population. A new user is a visitor whose first_visit event falls inside the selected range, and that is a subset of the visitors seen in the range. This number used to come from somewhere else and could exceed total users; it no longer can.
Why is the Conv. column zero for every channel in Top channels?
Because no key events are defined for this property. That column divides key-event count by session count, so with an empty key-event list the numerator stays zero. Define your key events in Admin and the column fills in.
Why doesn't average session duration match another tool I use?
AdPix builds duration from the engagement_time_msec parameter — the time the tracker actually observed the user active on the page — not from the span between a session's first and last event. A session where the user left the tab idle in the background gets a shorter duration here.
Is "Users right now" the same number as the Realtime report?
Yes. Both count unique users active in the last 30 minutes, with the same definition and the same window. If you switch the Realtime page to a 5- or 60-minute window that figure changes there, but the Home card always shows 30 minutes.
Thanks — your feedback helps us improve the docs.