Engagement overview
Once you know where visitors come from, this page tells you what they did once they arrived: which events fired, which pages were read, and which of your domains carries the traffic.
The four numbers at the top#
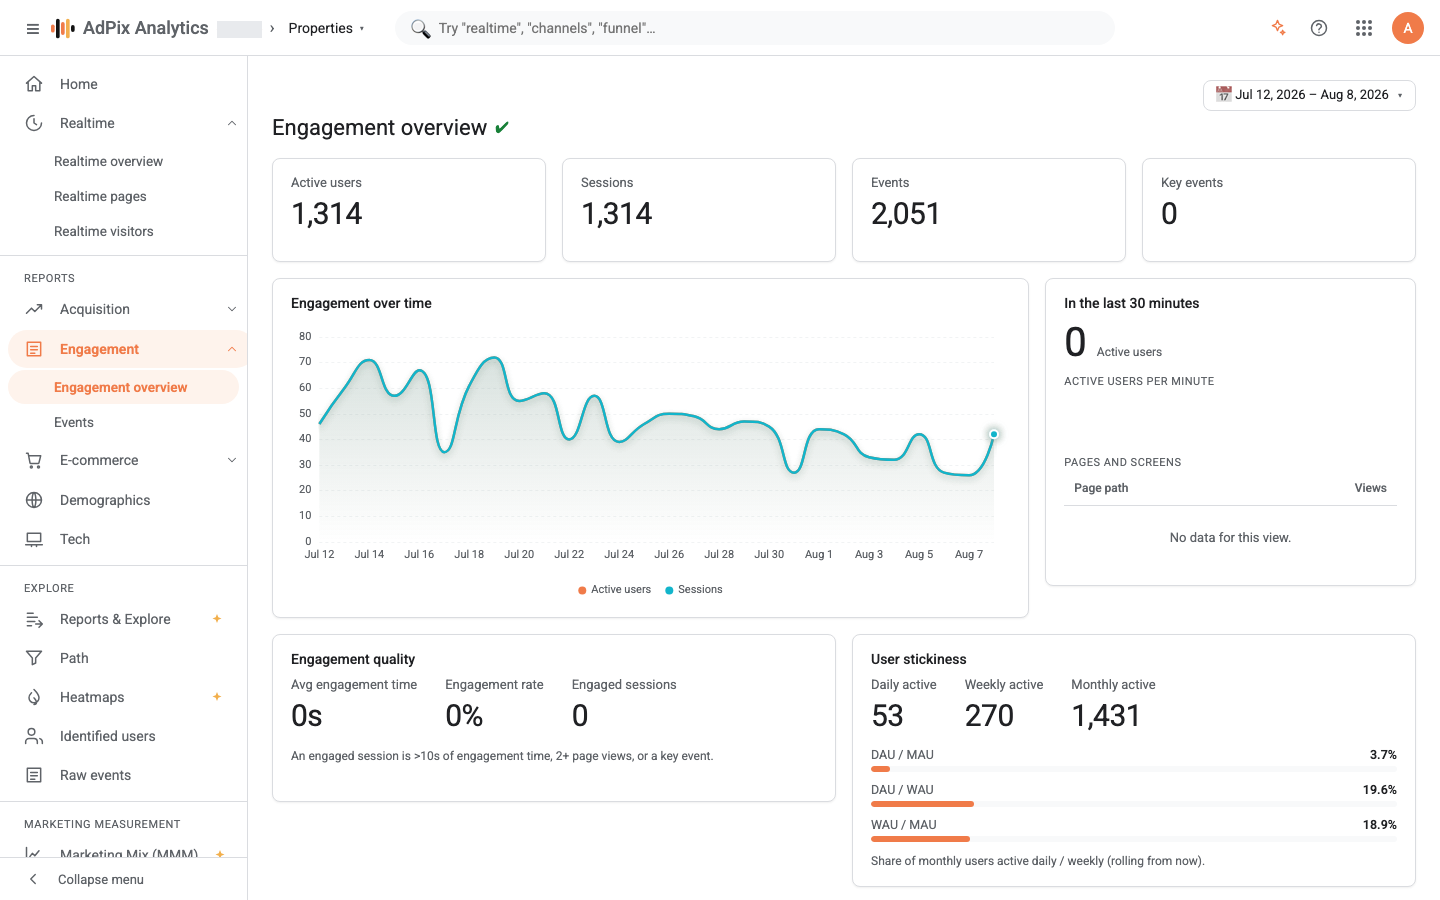
Engagement overview lives at /engagement and opens with a metric row: Users, Sessions, Events and Key events. All four are computed over the selected range in the property's timezone, and when period comparison is on they carry the change against the previous period.
Until the response arrives you see a loading indicator rather than zeros or a "no data" message — so a zero on this page really means zero.
The events table#
Each row is one event name, with three columns: Count, Users and Value. Events marked as key events on the property carry a KEY badge beside the name.
Two things to know about this table:
- Page views are not in it. Page view is usually the busiest event on any site, and including it here would bury everything else. Find the page-view count in the headline metrics, in the Pages and screens card, and in the Events report.
- The Value column is about key events only. It sums the
valueparameter on key events, not on every event. An event that is not a key event shows a dash there even if it does send avalue.
Key events are defined under Admin → Key events. Because the list is applied when the report is read, marking an event as key applies to history immediately.
Anything valuable to your business can be one: purchase, a contact-form submit, a trial start, a phone call. The Key events metric here, the Session key event rate in Traffic acquisition and the engaged-session definition all read from this one list.
Pages and screens#
This card counts page paths with Views, Users and Sessions, ordered by views.
A page path is the path part of the URL, without the domain. So /pricing is one row across every domain and subdomain of the property; if you want to know which domain carries the load, that is the next card.
One thing that helps you read the rows: a page view is counted per real URL change. A replaceState on the same URL — sorting a table, switching a tab, applying a filter — does not produce a new view. The details are in page views and single-page apps.
Hostnames#
The Hostnames (domains & subdomains) card carries the same three metrics, grouped by the domain the event happened on, derived from the page URL.
It earns its place when a property spans several domains or subdomains: the shop on shop.example.com, the customer panel on my.example.com, the main site on example.com. A domain you did not expect to see usually means the tag is installed somewhere you had forgotten — a staging environment, or an old subdomain.
A domain that is missing is usually one of two things: the tag is not installed there, or the domain is not registered on this property and its traffic is going somewhere else.
What engagement means, precisely#
Three terms that recur across the product and are worth pinning down once:
| Term | Definition |
|---|---|
| Engagement time | real time spent on the page, from the user_engagement event the tracker sends |
| Engaged session | a session with at least 10 seconds of engagement time, or at least two page views, or at least one key event |
| Engagement rate | the share of sessions that are engaged — and bounce rate is 100 minus that number |
Engagement time is not derived from the gap between event timestamps. An event's timestamp is the moment it reached the server, and because the tracker sends events in batches, several events of one session can be recorded in the same instant. So the tracker measures the duration itself and sends it in the engagement_time_msec parameter; any span over thirty minutes is discarded so an open background tab cannot invent one.
This page has no duration column. To see Avg. engagement time, Engaged sessions and Engagement rate broken down by channel, source, campaign, landing page or device, go to Traffic acquisition.
A five-minute review#
If you want to turn this page into a weekly habit, this order gets the most out of it:
What this page does not count#
- Server-side events have no page URL, so they do not appear in Pages and screens or in Hostnames. They are in the events table and in the key-event metric.
- Test-mode events are not counted in any of these cards.
- Events that never got the consent they need are not sent at all. If the events table has suddenly thinned out, check the consent configuration before anything else.
Seeing scroll, click, file_download and form_submit and no business events means enhanced measurement is working but your own events are not being sent yet. Setting them up is covered in enhanced measurement and the tracker reference.
Frequently asked questions#
Why is `page_view` missing from the events table?
Because the table deliberately leaves page views out so the busiest event on any site does not bury the rest. The page-view count is in the headline metrics and in the Pages and screens card, and the Events report lists page views in its own table.
What does the KEY badge next to an event mean, and how do I add one?
It means the event is marked as a key event on this property — what other tools call a conversion. The list is managed under Admin → Key events, and any change to it applies immediately to the key-event metric and the Value column, history included.
Which screen shows engagement time?
Average engagement time has its own column, per dimension, in the Traffic acquisition report. This page counts events and pages; it has no duration column.
Why aren't the orders I record from my server in the pages table?
Because those events have no page URL — they did not happen in a browser. They are fully present in the events table and in key-event and revenue counts, but no page-based report shows them.
Thanks — your feedback helps us improve the docs.